Statewide Public Four-Year Dashboard
About this Dashboard
OFM worked with the six public universities and colleges to create this centralized dashboard that displays several accountability measures, such as, graduation rates and the time it takes to complete a bachelor’s degree for each institution and statewide.
The metrics are organized into the three categories listed in the bar above, with the specific metrics listed below.
Student Enrollment |
Student Progress |
Degrees and Graduates |
|---|---|---|
|
|
|
About this Dashboard
For important information about data time range, availability, sources, and limitations, please see About the Data.
Questions
Please contact Tess Grayson, higher education analyst for the Office of Financial Management, at tess.grayson@ofm.wa.gov.
Frequently Asked Questions (FAQs)
Table of Contents
- What is the purpose of the dashboard?
- Where does the data for this dashboard come from?
- How was this dashboard developed?
- Why isn’t all of higher education included in this dashboard?
- When I choose particular measures, the chart display is blank. Why?
- Why can’t I find information for a specific institution?
- What are pre-college courses and who offers them?
- How do I read the graduation/continuation rate charts?
- The charts for the recent years in the Success metrics show a much lower success rate than early years. Why?
- Why are the totals in the Credits to Degree tables so low for some schools or type of student?
- Why is the data displayed on the dashboard different from other sources of data?
- A document (like the Metrics Calculations document) has been updated but I’m not seeing any changes. What do I need to do to see the updated document?
- How do I print or save what I am looking at?
- When is the dashboard updated with new data?
- Who do I contact about questions, suggestions, or training on how to use the dashboard?
What is the purpose of the dashboard?
The purpose of the dashboard is to provide the public a view of public, four-year institution information. It provides a high-level overview of the types of students enrolled, retained and completing, in addition to the types of degrees awarded. While dashboards can never provide a solution for a particular “issue,” they can be used to determine what direction a decision-maker may go to gather more information.
This dashboard represents a large amount of data that have been aggregated according to specific definitions and calculations. The dashboard was created because viewing this data in a spreadsheet would be overwhelming and difficult to comprehend. Data visualization can help viewers interpret data and draw conclusions more easily. Tableau was chosen as a data visualization tool because of its ease of use and broad array of visualization possibilities.
In 2011, the Legislature passed E2SHB 1795, related to higher education. In an effort to streamline the numerous accountability measures collected by different agencies, the Legislature requested that the public four-year institutions report on many of the Complete to Compete metrics identified by the National Governors Association. The majority of measures identified in E2SHB 1795 are similar to the metrics in the Complete to Compete technical guide.
Where does the data for this dashboard come from?
The source of data for this dashboard is from OFM’s Public Centralized Higher Education Enrollment System (PCHEES) that includes enrollment and completion data from 2007-08 forward.
How was this dashboard developed?
Data from OFM’s Public Centralized Higher Education Enrollment System (PCHEES) was compiled by OFM staff, who shared it with the public four-year institutions’ institutional researchers and the Council of Presidents for their review of definitions, calculations and processes. The Office of Financial Management used Tableau to create the dashboard, and examples of format were shared with COP and legislative staff for comment. Usability sessions were conducted and changes to the display were made based on user recommendations.
Why isn’t all of higher education included in this dashboard?
The legislation only refers to the public four-year institutions. The State Board for Community and Technical Colleges has information about the public community and technical colleges’ enrollment and completions and the Independent Colleges of Washington has information about the private, not-for-profit four-year institutions enrollment and completions.
When I choose particular measures, the chart display is blank. Why?
That particular measure may not exist for the institution or year chosen. For example, the graduation/continuation chart for the University of Washington Transfer student with a DTA/AST is blank because this level of information about a transfer degree is not provided by UW.
Why can’t I find information for a specific institution?
- Their data may not be submitted to OFM for inclusion in the dashboard.
- The metric may not apply to the institution. For example, pre-college information is displayed only at a statewide level because only two institutions provide pre-college courses (Central Washington University and Eastern Washington University. In another example, The Evergreen State College is not included in the Success in College Courses metric because their course structure does not support this type of reporting.
What are pre-college courses and who offers them?
Pre-College courses, also referred to as remedial courses, are courses used by institutions to prepare students for college-level math and English courses.
The majority of pre-college courses are offered at a community or technical college and Central Washington University and Eastern Washington University are the only public four-year institutions that offer pre-college courses. Students in other institutions attend courses offered by a community or technical college. For these two reasons, any conclusions drawn about pre-college students apply only to the students at Central Washington University and Eastern Washington University and may or may not reflect pre-college students in the community and technical college system.
For information about pre-college students in the community and technical college system, please visit the State Board for Community and Technical Colleges website.
How do I read the graduation/continuation rate charts?
These charts follow a particular cohort of students longitudinally (over time) and categorizes them by graduated, continued or not found. In this chart, we use the term continuation to characterize a student who is enrolled. In the past, the term retention was used but we felt this would be confusing because retention has a different connotation in the K-12 system.
If you click on 2007-08, this chart provides information about a group of students that began at the institution in the Summer or Fall of 2007. For each column shown on the chart, the orange area represents the percentage of students who continued into the following year; the red area represents the percentage of students who graduated that year; the blue area represents students whose records were not found the following year. If a student did not graduate by the end point, in this case Spring 2008, and was not enrolled in this term, they are considered not found.
This first year listed does not represent a whole year, only Fall to Spring, so this is NOT Year 1. The second line up is the Fall to Fall rate, commonly used to determine the freshman retention rate for Direct from High School students. Below is a description of the lines in this chart:
| Direct from high school | Transfer | |
|---|---|---|
| Seventh column | Six-year graduation rate | |
| Sixth column | Five-year graduation rate | |
| Fifth column | Four-year graduation rate | Four-year graduation rate |
| Fourth column | Junior continuation | Three-year graduation rate |
| Third column | Sophomore continuation | Two-year graduation rate |
| Second column | Freshman continuation | Junior continuation |
| First column | Fall to Spring | Fall to Spring |
Because the Public Centralized Higher Education Enrollment System (PCHEES) system begins with 2007-08 data, the charts for this year are the most complete, but still do not have complete data for the sixth line and there is no seventh column because we do not have the completion data yet. The five-year graduation rate (sixth column) is only accurate to demonstrate how many students from the cohort have returned to school. Many of the students in the “Not found” category are not at the school anymore because they graduated in the 2011-12 school year and this completion data is not submitted to OFM until July 2013. This time lag is necessary to get more accurate and complete data. When the dashboard is updated next December, the data in the sixth line will show a higher graduation rate and a lower percentage in the not found category.
The charts for the recent years in the Success metrics show a much lower success rate than early years. Why?
The Success metrics measure student success in courses TWO years after an event, either after taking a pre-college course or beginning at the institution. To fully report this metric, we need three years of data. The early years have all three years and the later years have less than three years. All years of available data are displayed so users have access to recent data but comparisons should not be made between years that have complete data and years with incomplete data. Any conclusions drawn are likely to be incorrect.
Why are the totals in the Credits to Degree tables so low for some schools or type of student?
- Washington State University operates on a semester system so their typical program requires 120 credits to graduate. When comparing to quarter-system schools, multiply the WSU numbers by 1.5. The statewide calculation converts WSU's semester credits by calculating by 1.5.
- When calculating credits to degree at the institution level, only credits earned at that institution are included in the calculation. The statewide calculation includes credits earned at the institution and credits transferred from other institutions.
Why is the data displayed on the dashboard different from other sources of data?
There are a number of reasons displayed data is different from other sources, such as IPEDS (Integrated Postsecondary Education Data System).
- Definition of academic year. In some cases, counts are based on Summer through Spring and in other cases, counts are based on Fall through Summer.
- Timing of the data pull. More recent data tends to understate completions because it takes time to reconcile this data. Data pulled one year after a term ends will be more complete than data pulled a few months after a term ends. There is always a struggle between timing and completeness.
- Calculations. This dashboard has adopted a broader view when it comes to calculating rates, such as graduation rate. Where IPEDS limited their calculation to first-time/full-time freshmen, this dashboard includes all students that begin in a particular Fall term. In addition, the statewide calculation counts all completions, regardless if a student began at one public institution but finished at another. Because IPEDS cannot account for students that transfer, their graduation rates will not provide this part of the story.
A document (like the Metrics Calculations document) has been updated but I’m not seeing any changes. What do I need to do to see the updated document?
Browsers remember sites and pages you have previously visited. That information is stored in the browser’s history. If you know a site or page has been changed and you’re not seeing the changes, you will need to clear your browser’s history. Depending on the browser you use and how much history you want to clear, there are different steps to follow. Contact the PCHEES Helpdesk phcees.helpdesk@ofm.wa.gov if you need assistance.
How do I print or save what I’m looking at?
In the Tableau Toolbar, click on the Download button. You can save the Tableau Workbook and open it using either Tableau Public (free) or Tableau Desktop.
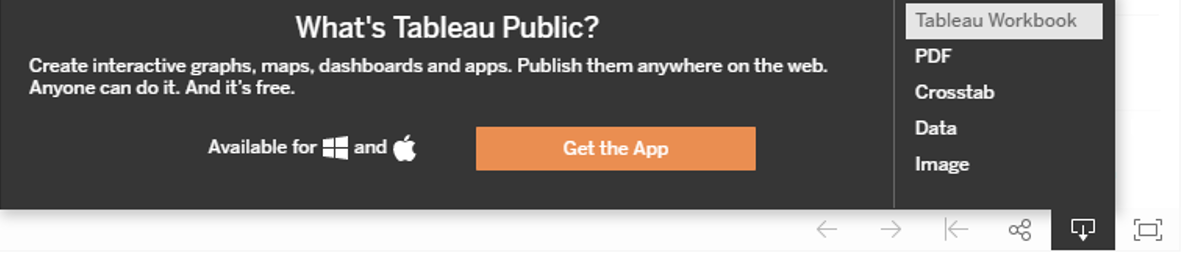
Alternatively, if you want the underlying data, click the  button at the top right of the dashboard.
To print, click on the Download Button on the Tableau Toolbar. Save the report as an image or PDF and then print the image/PDF.
When is the dashboard updated with new data?
The dashboard is updated annually in the Fall after the required data submissions have been validated.
Who do I contact about questions, suggestions, or training on how to use the dashboard?
Please contact Tess Grayson, higher education analyst for the Office of Financial Management, at tess.grayson@ofm.wa.gov.
About the Data
For more details on how variables in this dashboard were calculated from their sources in the Public Centralized Higher Education Enrollment System (PCHEES), see the Metrics Calculations document.
Data range
Academic years span from the beginning of summer term in one calendar year to the end of spring term in the next calendar year. This dashboard includes data for academic years and terms as displayed below.
Enrollment data are summarized over the academic year. Data in this dashboard cover summer term in academic year 2007-08 through spring term in academic year 2022-23: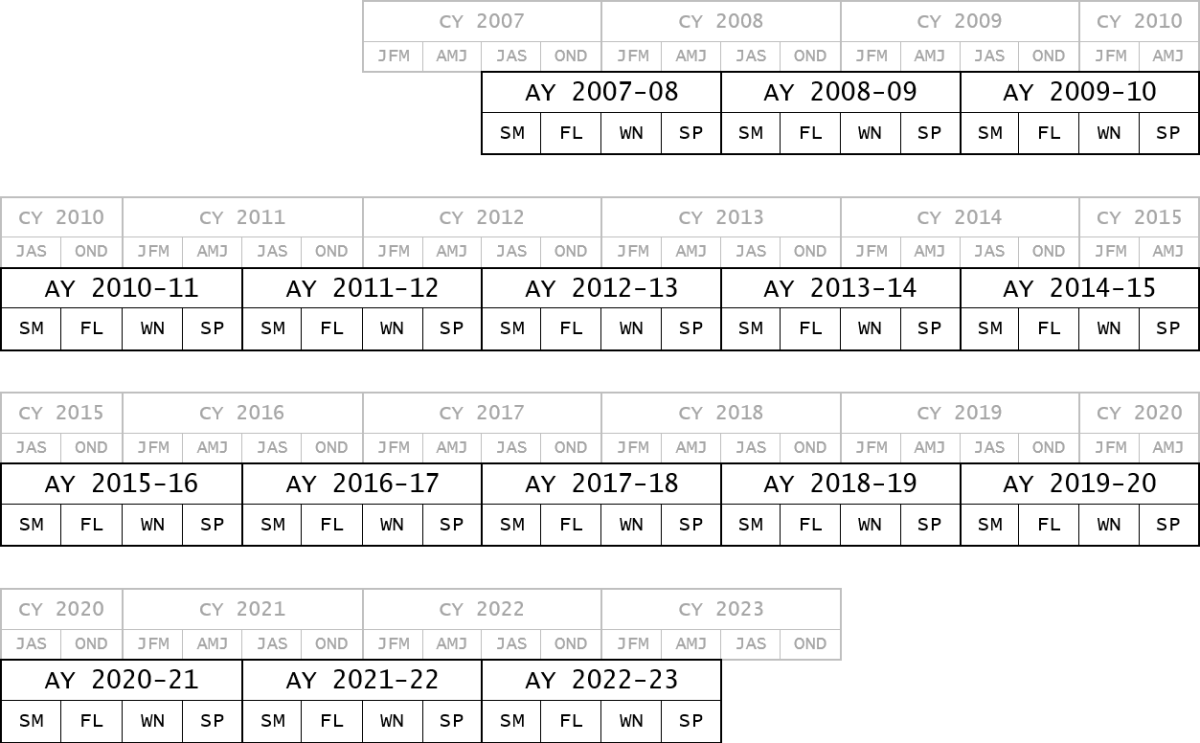
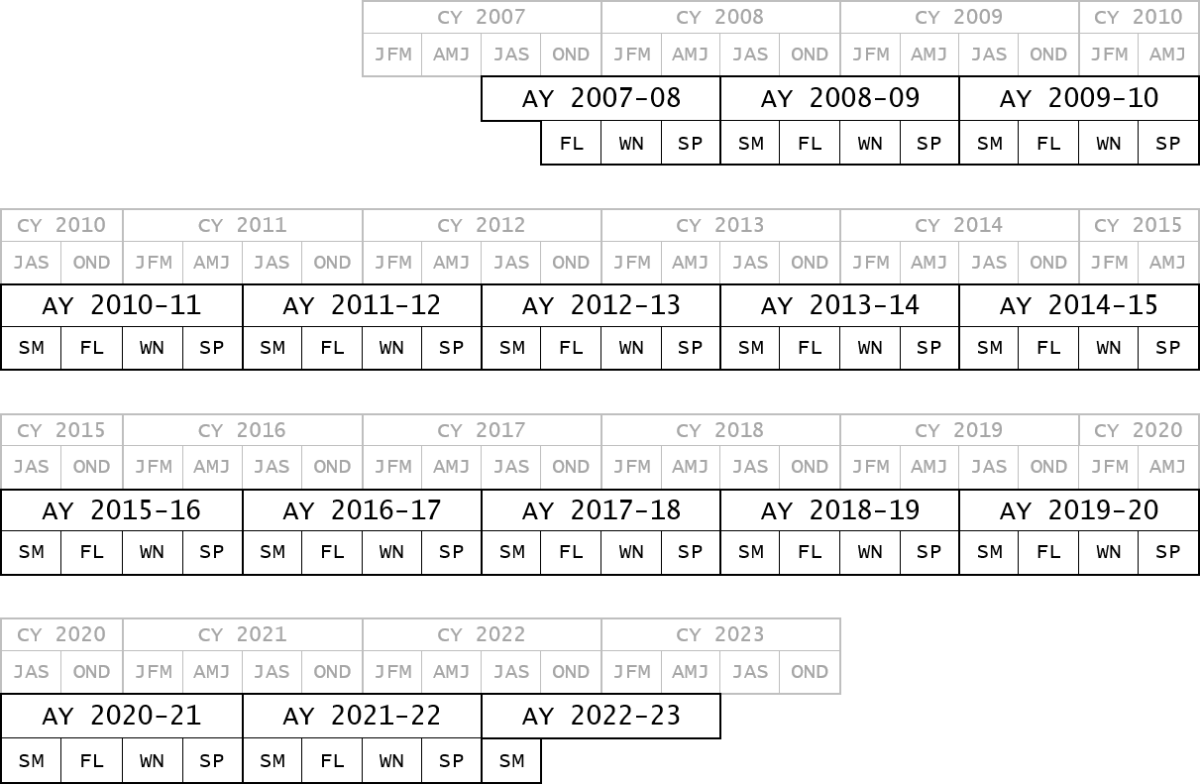
Completion data are summarized over fall term in one academic year through summer term in the next academic year, because many students finish their coursework in one term but do not receive their degree or certificate until a following term. The final summer term data is needed to provide a whole year’s worth of completions for the last year displayed in the dashboard. Data in this dashboard cover fall term in academic year 2007-08 through summer term in academic year 2022-23:
Data source
The source of data for this dashboard is Washington State’s Office of Financial Management Public Centralized Higher Education Enrollment System (PCHEES).
This dashboard does not contain any two- or four-year data from the Community and Technical College system.
Data definitions
The information displayed in this dashboard is based on definitions and calculations provided in the Complete to Compete Common College Completion Metrics. The definitions and calculations may be different from how individual institutions or other sources of higher education information calculate similar measures.
All enrolled students, regardless of funding source, are included in the dashboard. Please see Data definitions for a list of definitions and Metric calculations for a description of how the metrics were calculated. For this reason, before comparing numbers or rates from different sources, please be sure you understand the calculations behind the measures. OFM staff are available to assist with interpretations of the measures.
Maintaining student privacy and FERPA
OFM prioritizes student privacy and has developed suppression rules that meet the law and intent of the Family Educational Rights and Privacy Act (FERPA). These suppression rules are applied to the data before it is released for display.
In most cases, suppression is not needed for disaggregated data at a statewide level because the number of students in each grouping ensures that someone cannot determine identifiable information about a student or group of students. When data is displayed at the institution level, suppression may be required when the number of students in a grouping would allow someone to determine identifiable information about a student. OFM performs this suppression by calculating the minimum subgroup size for the extent of years displayed. The suppression logic is applied to all years prior to and including the final year a subgroup size of less than 10 is observed.
When displaying count data (“Student Enrollment” metrics and Number of Degrees), OFM either masks or recodes demographic characteristics to protect student privacy. For example, if there are only 5 female undergraduate students enrolled in AY2012-13 that are not Washington residents, the gender of these students will be masked (“Details Redacted”) for all years prior to and including the final year a subgroup size of less than 10 is observed. When disaggregating students by Race/Ethnicity, groups of fewer than 10 are shown as “Unknown.” Since the “Unknown” category also contains students that did not report a race/ethnicity, it is impossible to calculate a suppressed value by subtraction.
When displaying performance metrics (All “Student Progress” metrics, Time to Degree, and Credits to Degree), if a subgroup size is less than 10 then all years of data prior to and including the final year for that subgroup are not displayed.
Users of this dashboard should understand that data suppression is done to protect student privacy because the number of students in that grouping is too small to display.
For more information about FERPA or other privacy initiatives, please visit the Department of Education Privacy Technical Assistance Center (PTAC).
Partners
OFM Forecasting and Research Division worked with the partners below to create this dashboard.
- Central Washington University (CWU)
- Eastern Washington University (EWU)
- The Evergreen State College (TESC)
- University of Washington (UW)
- Washington State University (WSU)
- Western Washington University (WWU)
- Council of Presidents (COP)
Updates
The dashboard is updated annually in the Fall after all the required data submissions have been validated.
Data Definitions
For more details on how variables in this dashboard were calculated from their sources in the Public Centralized Higher Education Enrollment System (PCHEES), see the Metrics Calculations document.
Academic year
In some cases, the academic year is defined as beginning with the Summer term and ending with the Spring term; closely following the fiscal year. In other cases, typically when looking at graduation metrics, the academic year is defined as beginning in the Fall term and ending with the Summer term.
Age
Age was calculated as of the beginning of the term.
CIP Codes
The Classification of Instructional Programs (CIP) provides a taxonomic scheme that supports the accurate tracking and reporting of fields of study and program completions activity. The CIP was developed by the U.S. Department of Education's National Center for Education Statistics (NCES) in 1980, with revisions occurring in 1985, 1990, 2000, 2010 and 2020.
Continuation rate
Of a starting cohort, consisting of entering students who enroll in the Fall of a particular year in an undergraduate program, the continuation rate represents the percentage of those students still enrolled in a subsequent term. For example, the four-year continuation rate is calculated by taking the number of students who began in Summer or Fall 2007 (ex. 15146), and the number of those students still enrolled in Fall of 2011 (ex. 3302), and dividing the latter by the former (3302/15146 = 21.8%).
Degrees
A count of Undergraduate and Graduate degrees awarded in an academic year. All degrees awarded are included in this count, even if one student earned more than one degree.
Direct from high school student
A student who enters a public four-year institution without any undergraduate credits. These students include:
- those who enter directly after graduating from high school; or
- those who enter after a period of time between high school graduation and entering higher education without any intervening higher education experience.
Direct from high school students may have earned college credits in high school (Running Start, Advanced Placement, or International Baccalaureate). They do not include transfer students from other higher education institutions.
Enrollment
The unduplicated count of students enrolled during the academic year. If a student is enrolled in more than one institution, the student is counted only once at the statewide level. These numbers will vary slightly from sources that report annual average where the total number of students enrolled each term is divided by the number of terms in an academic year.
Graduation rate
Of a starting cohort, consisting of entering students who enroll in the Fall of a particular year in an undergraduate program, the graduation rate represents the percentage of those students who graduated by the end of the subsequent term. For example, the four-year graduation rate is calculated by taking the number of students who began in Summer or Fall 2007 (ex. 15146), and the number of those students who graduated by Fall of 2011 (ex. 7417), and dividing the latter by the former (7417/15146= 49%).
Public Centralized Higher Education Enrollment System (PCHEES)
A system managed by OFM since 1998 to collect public, four-year higher education data at the student level. PCHEES has enrollment and completion data from the 2007-08 academic year forward.
Pell Grant / Washington College Grant recipient (formerly State Need Grant)
A student who received a Pell grant or Washington College grant. Note that in previous versions of this dashboard, the Washington College Grant was known as the State Need Grant. The name for the State Need Grant was changed to Washington College Grant in July 2019. This dashboard displays “Washington College Grant” for both State Need and Washington College Grants.
For the enrollment metric, a student is categorized as a Pell/Washington College Grant recipient if they received a grant in any term during the year being displayed.
When calculating graduation or retention rate, a student is categorized as a Pell/Washington College Grant recipient if they received a grant in any term during their first year at the institution.
For degree recipients, a student is categorized as a Pell/Washington College Grant recipient if they received a grant in any term prior to receiving the degree.
Pre-college course taker
For the enrollment metric, a student is categorized as a Pre-College course taker if they enrolled in a pre-college math or English course in any term during the year being displayed.
When calculating graduation or retention rate, a student is categorized as a Pre-College course taker if they enrolled in a pre-college math or English course in any term during their first year at the institution.
For degree recipients, a student is categorized as a Pre-College course taker if they enrolled in a pre-college math or English course in any term prior to receiving the degree.
Race or ethnicity
Hispanic Origin and Race/Ethnicity are asked of students separately. A student can identify any Hispanic Origin and then identify a race or ethnicity (Black, White, Asian-American and Native Hawaiian or Pacific Islander, American Indian or Alaska Native). International students do not indicate a Hispanic Origin or race/ethnicity.
- Hispanic- A student that indicates any Hispanic origin is classified in this group, regardless of the race or ethnicity indicated.
- Black, non-Hispanic- A student that indicates their race/ethnicity as Black with no Hispanic origin.
- White, non-Hispanic- A student that indicates their race/ethnicity as White with no Hispanic origin.
- Asian-American, Native Hawaiian or Pacific Islander, non-Hispanic (NHOPI) - A student that indicates their race/ethnicity as Asian-American, Native Hawaiian or Pacific Islander with no Hispanic origin.
- American Indian or Alaska Native, non-Hispanic- A student that indicates their race/ethnicity as American Indian or Alaska Native with no Hispanic origin.
- Multi-Racial - A student has indicated more than one race/ethnic group.
- Unknown – A student that did not indicate their race/ethnicity group or Hispanic origin. “Unknown” is also used to mask the race/ethnicity of students that are in small subgroups.
- Other – A student who is not a U.S. resident or whose residency status is unknown. The race/ethnicity or Hispanic origin for these students are excluded from the race/ethnicity and Hispanic origin categories.
Sex
A sex designation of male or female. A new vital records law and rules became effective January 27, 2018, where individuals can change the sex designation on their birth certificate and other legal documents. The new law added ‘X’ as a third sex designation. Only two institutions reported any students as Sex X at the time this dashboard was published.
STEM/High employer demand
Defined by the Classification of Program (CIP) code. Science, Technology, Engineering and Mathematics (STEM) programs are identified by a list maintained by the U.S. Immigration and Customs Enforcement (ICE) agency. High employer demand programs are identified by the institutions, in consultation with the Workforce Training and Education Coordinating Board and the Washington Student Achievement Council, based on the needs of the state. (Updated December 2020)
Transfer student
A student who enters a public four-year institution with undergraduate credits from another higher education institution, either two-year or four-year, not including credits earned through dual credit programs such as Running Start or Advanced Placement.
Transfer with DTA/AST student
A student who enters a public four-year institution with an Associate Degree classified as a Direct Transfer Agreement (DTA) or Associate in Science Transfer (AST) from another higher education institution.
If you have difficulties accessing any part of this website (e.g., assistive technologies that are not compatible with Tableau), please contact Andrew Weller at andrew.weller@ofm.wa.gov