This study explores the differences between post-graduation earnings of STEM and non-STEM bachelor’s degree graduates by gender, by specific college major, and by general race category. We use Propensity Score Matching to correct for selection bias where possible. We find a 65 percent female gender deficit in earnings among all STEM majors.
After selection bias correction, males are found to have a higher STEM premium than females with the difference being a measure of the gender deficit. During the third year after graduation the gender deficit is 65 percent (the male premium is $10,100 and the female premium is $3,600). This implies a 65 percent gender deficit for females (females lose out on 65 percent of the benefit from a STEM degree that males enjoy).
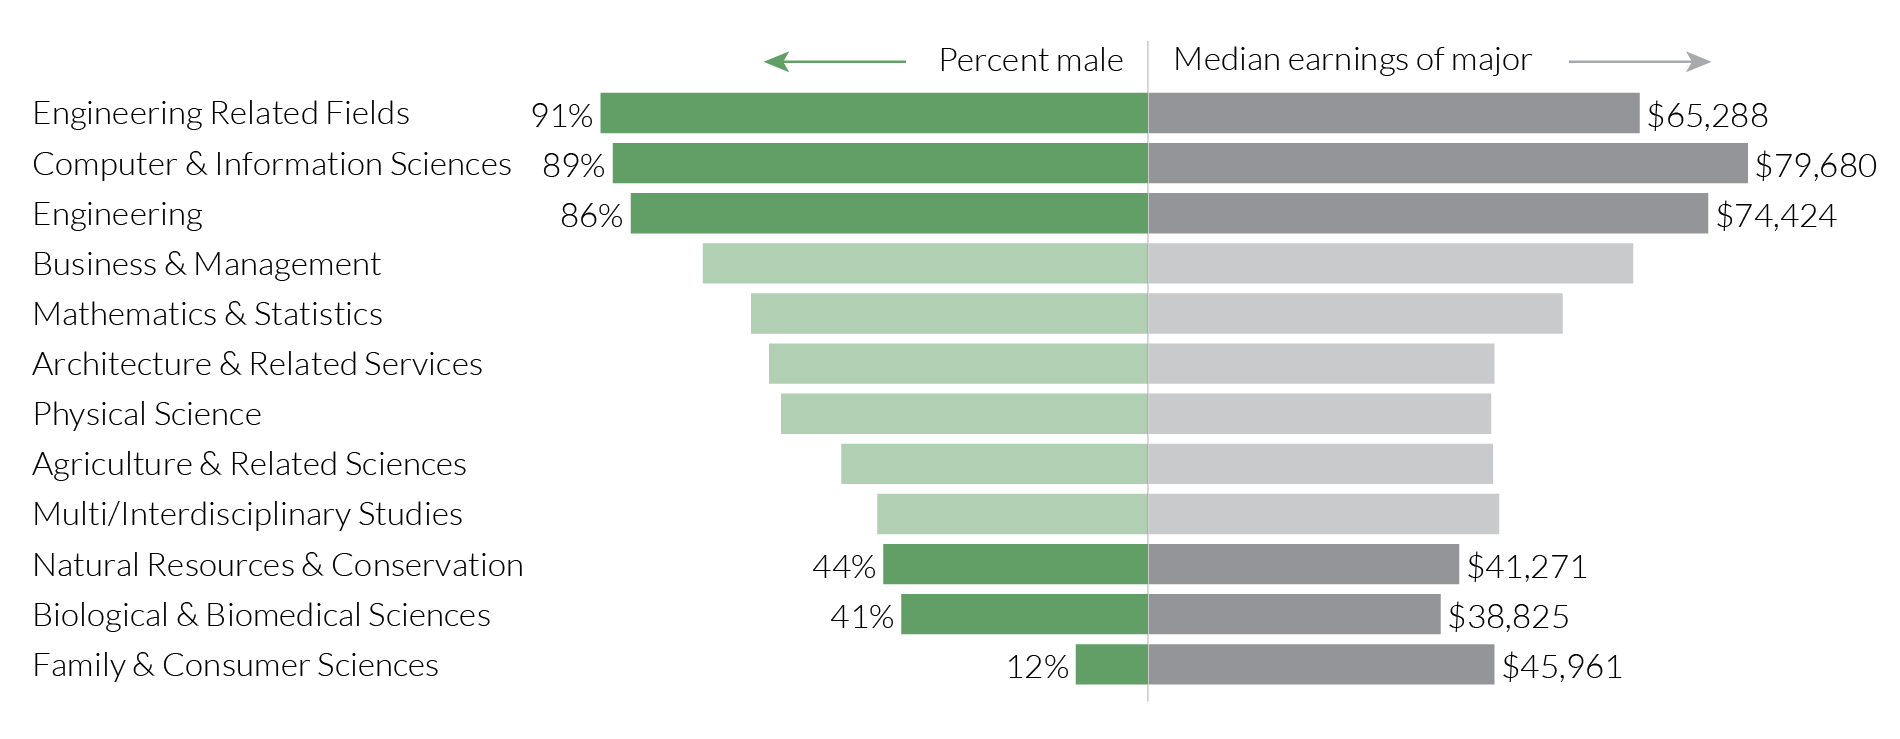
Majors with more females have lower post-graduation earnings. Race has no measureable relationship to the gender deficit. STEM majors in which males have the highest post-graduation earnings are also associated with higher earnings for females, though females select these majors much less frequently than males.
Encouraging students to take a STEM major remains a popular policy prescription. Though simply encouraging females into any STEM major may increase gender deficits. A more promising approach may be to encourage females into more remunerative majors such as computer science and engineering. In addition, effective approaches to counteract gender deficits may involve addressing both constraints and preferences regarding gender choices about STEM majors and earnings. Public policy should seek to remove overt and subtle gender-based discrimination in schools, universities and the workplace. Preference-based gender segregation is a difficult policy issue. Every child should be fully able to pursue their talents and goals, regardless of such superficial characteristics as gender.
Figure 1. How did the earnings of males and females relate with the proportion of males and females within each STEM major? (Annual real earnings, 2014 dollars, third year after graduation, no selection correction)