This report explored education outcomes of youth who were enrolled in ninth grade in a Washington state public school at any point during the 2004–05 academic year and who have had one or more truancies. The cohorts were followed for seven years through the 2011-12 academic year to allow for examination of both high school outcomes and postsecondary enrollment and outcomes.
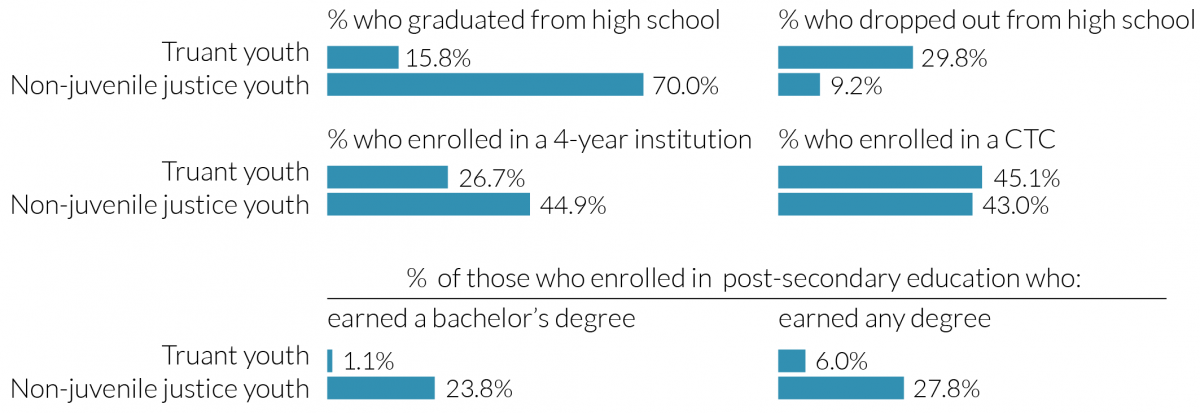
The study showed that truant youth were far less likely to graduate from high school (15.8 percent) compared with their peers in the comparison group (70.0 percent), and far more likely to drop out (29.8 percent) compared with their peers (9.2 percent). Male truant youth were 59 percent more likely to not graduate high school than female truant youth. The younger a truant youth was at first offense, and the more detention stays they had, the less likely they were to graduate (15.9 percent less likely each year earlier, and 38.6 percent less likely per stay).
Only 26.7 percent of truant youth enrolled in a four-year institution, compared to 44.9 percent of non-juvenile-justice youth. However, truant youth enrolled in a community and technical college program at higher rates than their non-juvenile-justice peers: 45.1 percent of truant youth enrolled in a CTC program, compared with 43.0 percent of non-juvenile-justice youth. Male truant youth were 39.6 percent less likely to enroll into a postsecondary program; races/ethnicities other than Black were 61.9 percent less likely to enroll into a postsecondary program; and the more detention stays youth had the more likely they were to enroll in a postsecondary program (4.9 percent less likely with each fewer detention stay). Six percent of truant youth who enrolled in a postsecondary program or institution earned a degree, compared to 27.8 percent of non-juvenile-justice youth. Of truant youth who enrolled into a postsecondary program, 1.1 percent earned a bachelor’s degree, compared with 23.8 percent of their non-juvenile-justice peers who enrolled.
Figure 1: Outcomes of truant youth compared with non-juvenile justice youth.